# Load the tidyverse package, which includes ggplot2 and other data manipulation tools.
library(tidyverse)
library(extrafont) #Note need to run extrafont::font_import() on the R console to import fonts
# Create a dataframe
df <- data.frame(
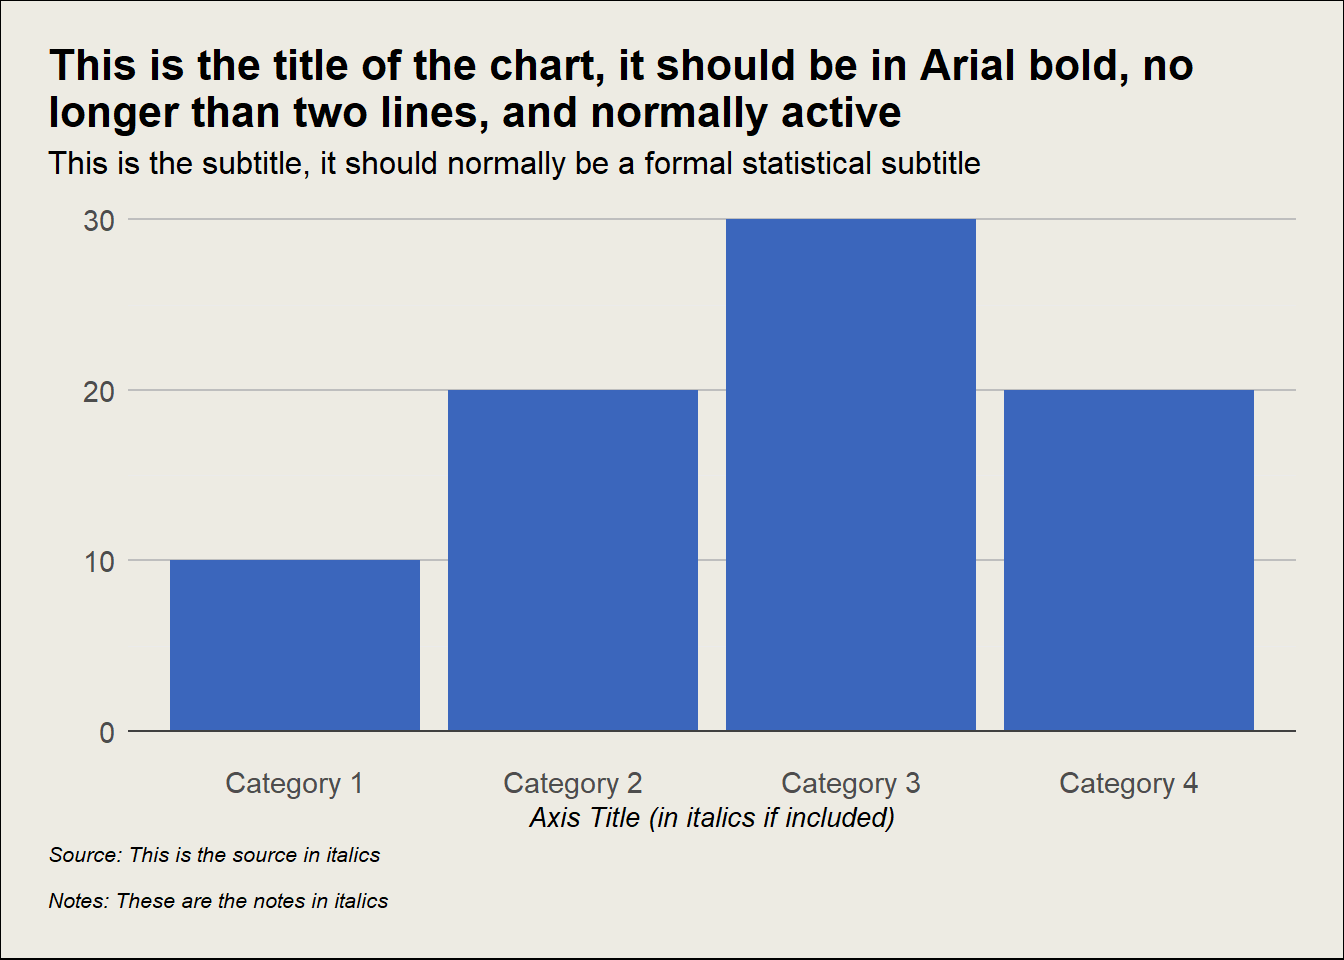
X_Axis_Title = c("Category 1", "Category 2", "Category 3", "Category 4"),
Y_Axis_Title = c(10, 20, 30, 20)
)
# Build the plot using ggplot2 package.
ggplot(df, aes(x = X_Axis_Title, y = Y_Axis_Title)) +
# Add bar elements to the plot. 'stat = "identity"' tells ggplot to use the y-values as they are.
geom_bar(stat = "identity", fill = "#3b66bc") +
# Add a horizontal line at y = 0, with a solid line type and a specified color.
geom_hline(yintercept = 0, linetype = "solid", color = "#404040") +
# Add labels for the axes, title, subtitle, and caption. Also format these elements.
labs(x = "Axis Title",
y = "",
title = "This is the title of the chart, it should be in Neuton, no longer than two lines,\nand normally active",
subtitle = "This is the subtitle, it should normally be a formal statistical subtitle\n",
caption = "Source: This is the source in italics\n\nNotes: These are the notes in italics") +
# Customise with TASO theme elements, including background colour, title positioning, gridlines.
theme_minimal() +
theme(
text = element_text(family = "Barlow", size = 12),
plot.title.position = "plot",
plot.title = element_text(family = "Neuton", size = 16),
plot.subtitle = element_text(size = 12),
plot.caption.position = "plot",
plot.caption = element_text(hjust = 0, size = 9, face = "italic"),
plot.background = element_rect(fill = "#EDEBE3", color = NA),
plot.margin = margin(0.25, 0.25, 0.25, 0.25, "in"),
panel.border = ggplot2::element_blank(),
panel.grid.major = element_line(colour = "#CECABC", linewidth = 0.3),
panel.grid.minor = element_blank(),
panel.background = ggplot2::element_rect(fill = "#edebe3", color = NA),
axis.text = element_text(size = 10),
axis.title = element_text(size = 9, face = "italic"),
axis.line.y = element_blank(),
axis.line = element_line(colour = "#485866", linewidth = 0.5),
axis.text.x = element_text(margin = margin(t = 7, unit = "pt")),
axis.ticks.length = unit(0.3, "cm"), # Increase the length of ticks
axis.ticks.x = element_line(colour = "#485866", linewidth = 0.5),
legend.position = "none"
)